We use analytics and cookies to understand site traffic. Information about your use of our site is shared with Google for that purpose.You can read our privacy policies and terms of use etc by clicking here.
Monitoring
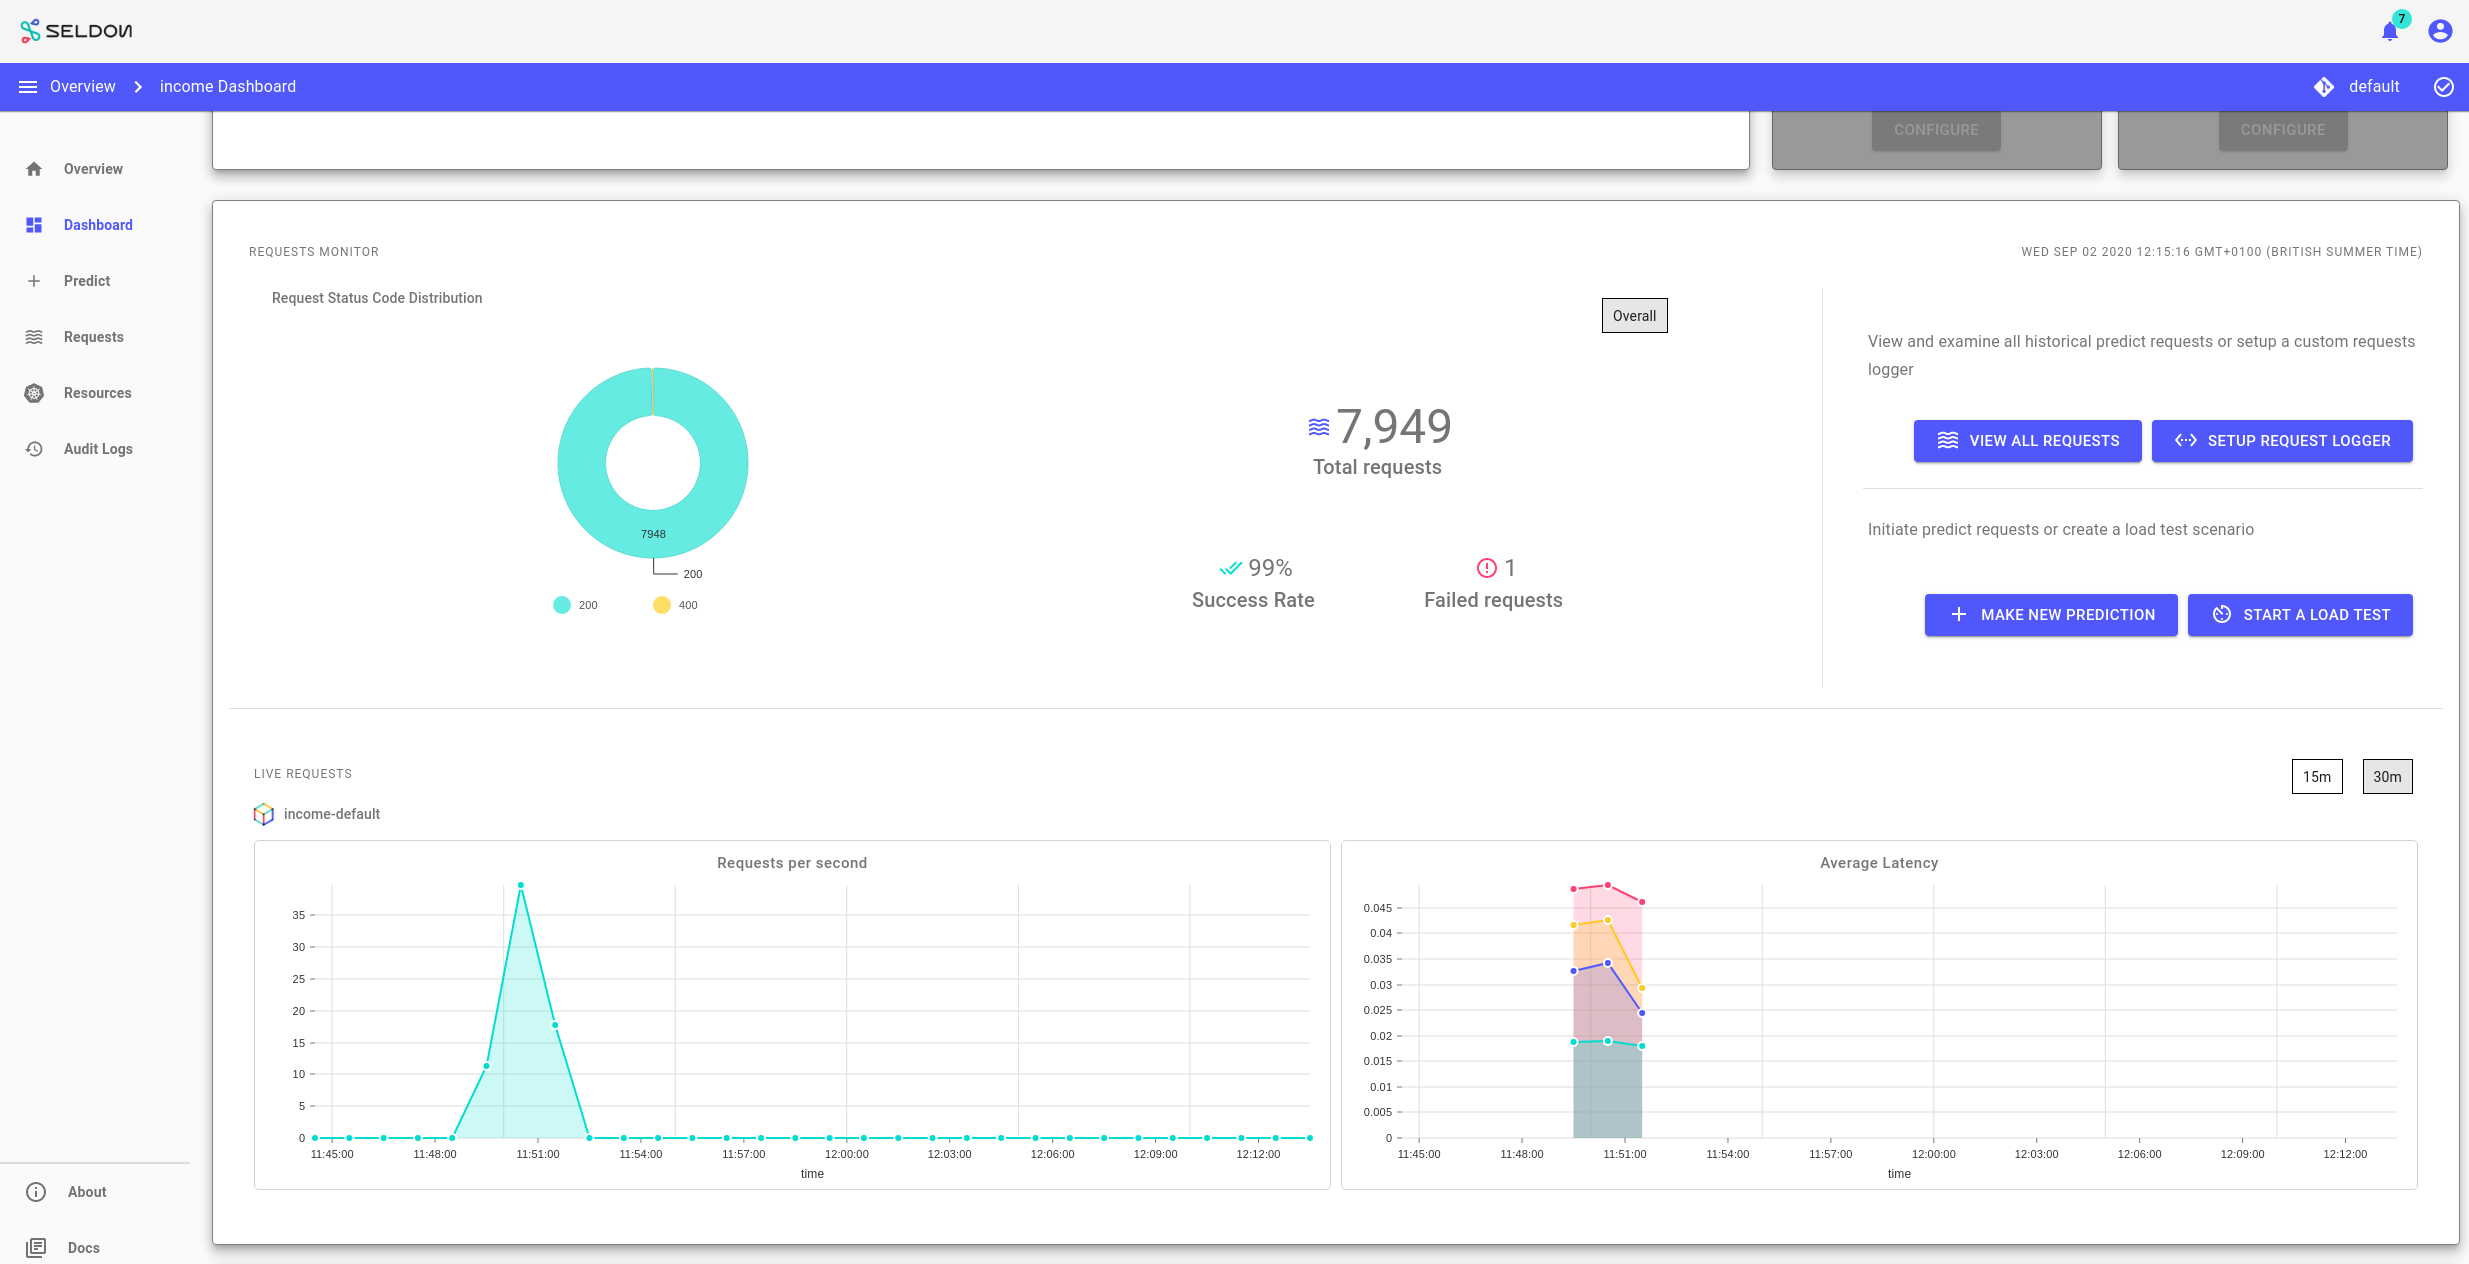
The deployment details view includes embedded grafana dashboards and panels

These show a summary of traffic going through the model, including request rate, indicators of request success/failure (based on status code) and latency.
Last modified October 29, 2019: Reorganizing project structure and adding WIP image explanations (8bfc877)