We use analytics and cookies to understand site traffic. Information about your use of our site is shared with Google for that purpose.You can read our privacy policies and terms of use etc by clicking here.
Model Explanations with Anchor Tabular
Launch an income prediction model and get explanations on tabular data.
In this demo we will:
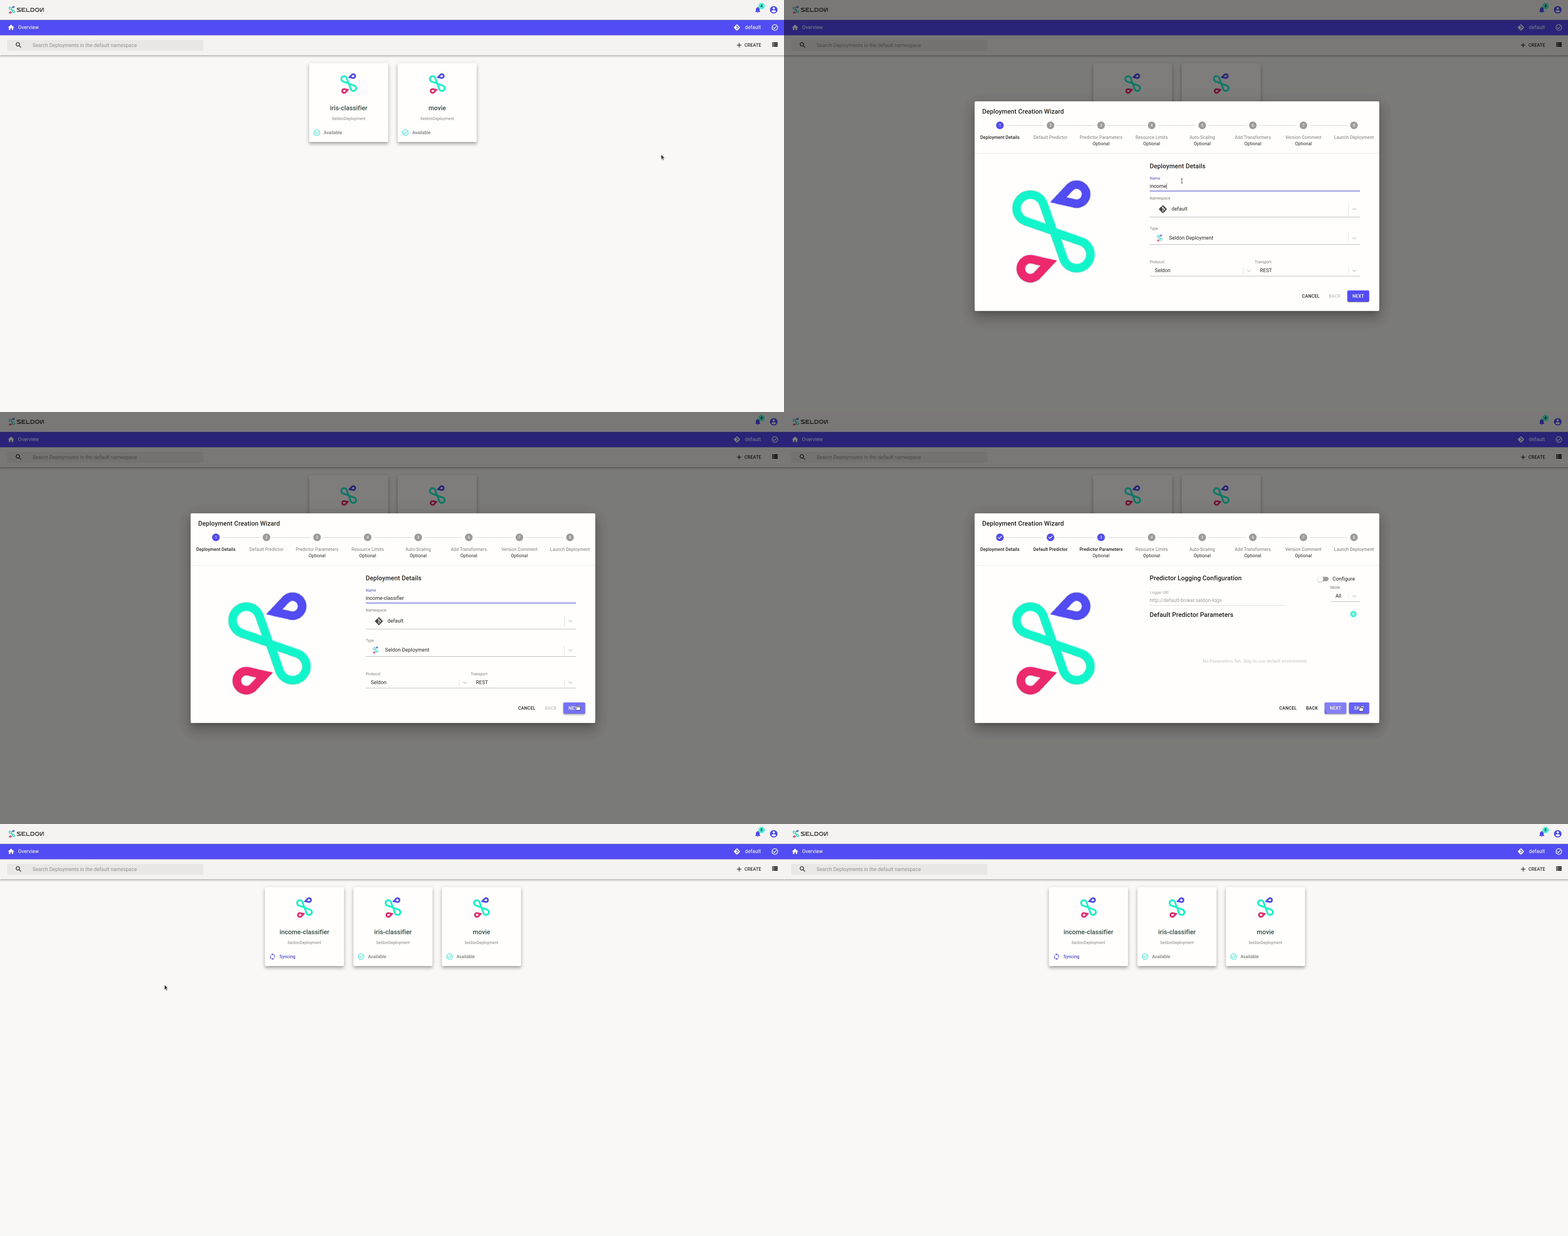
- Launch an income classification model which has tabular training features
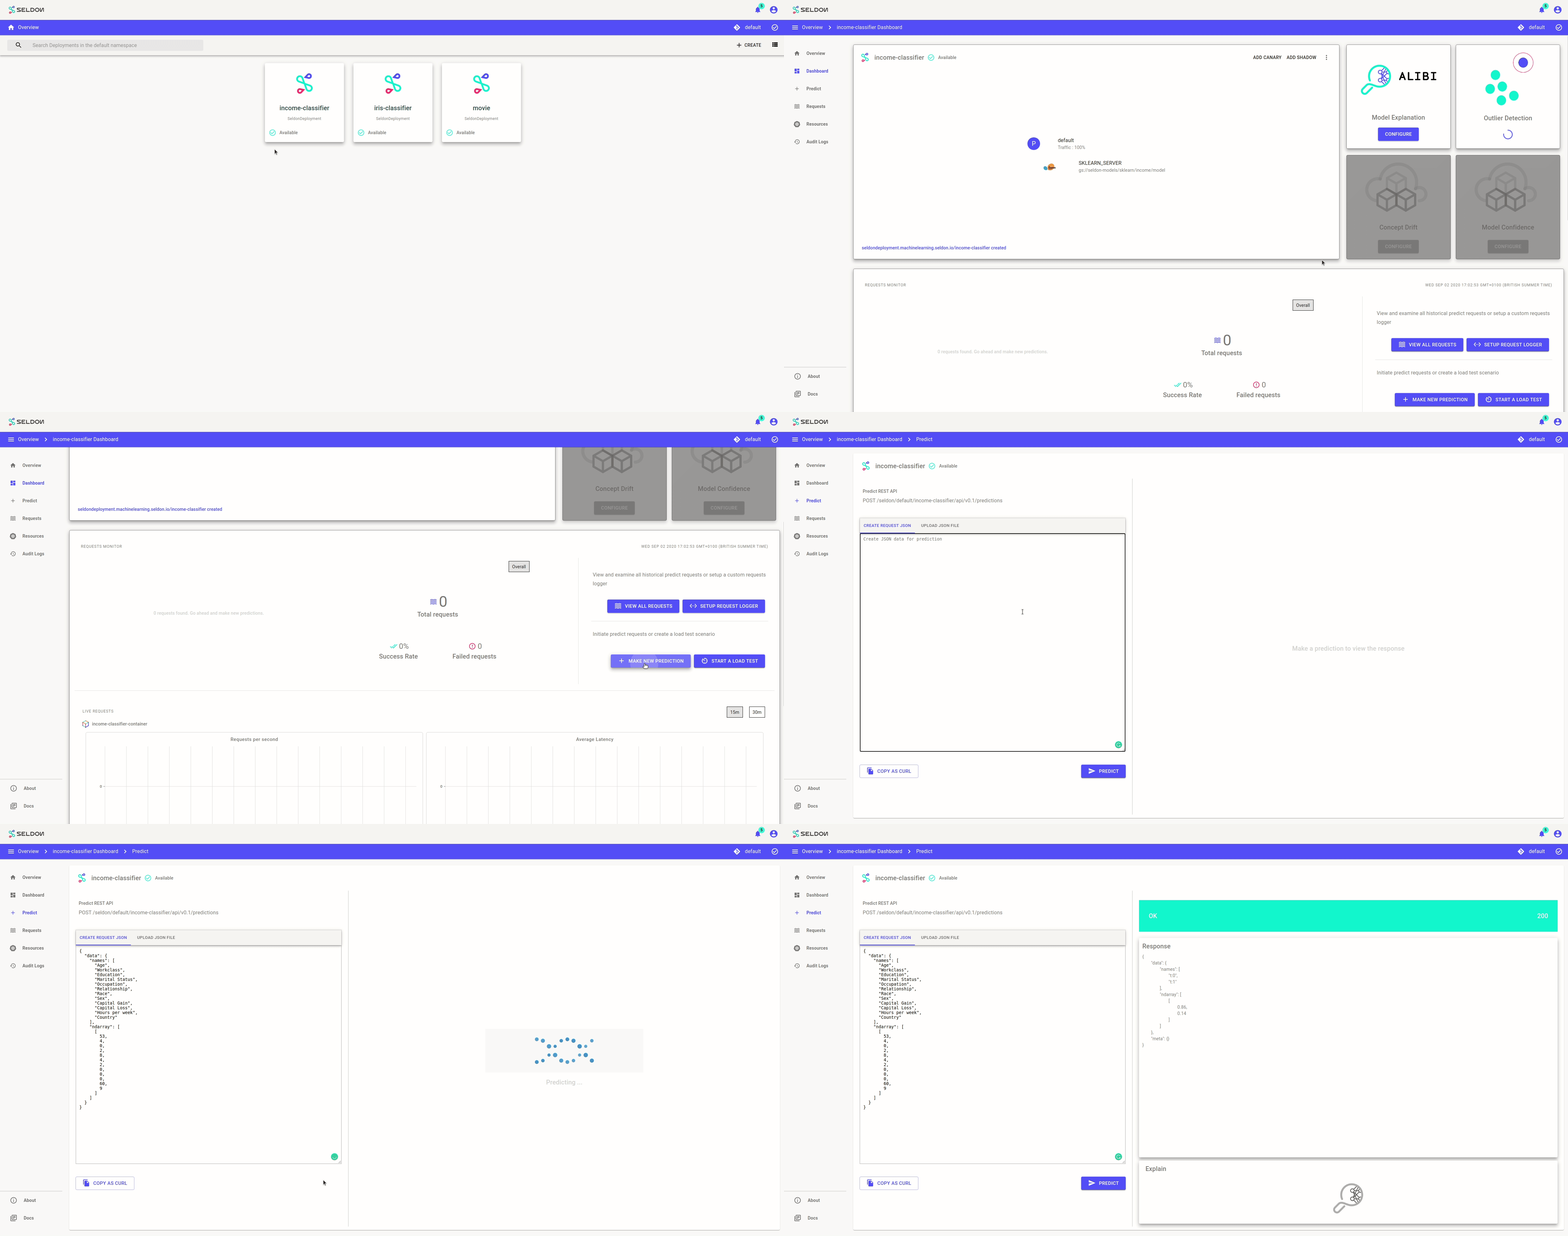
- Send a request to get a predicton
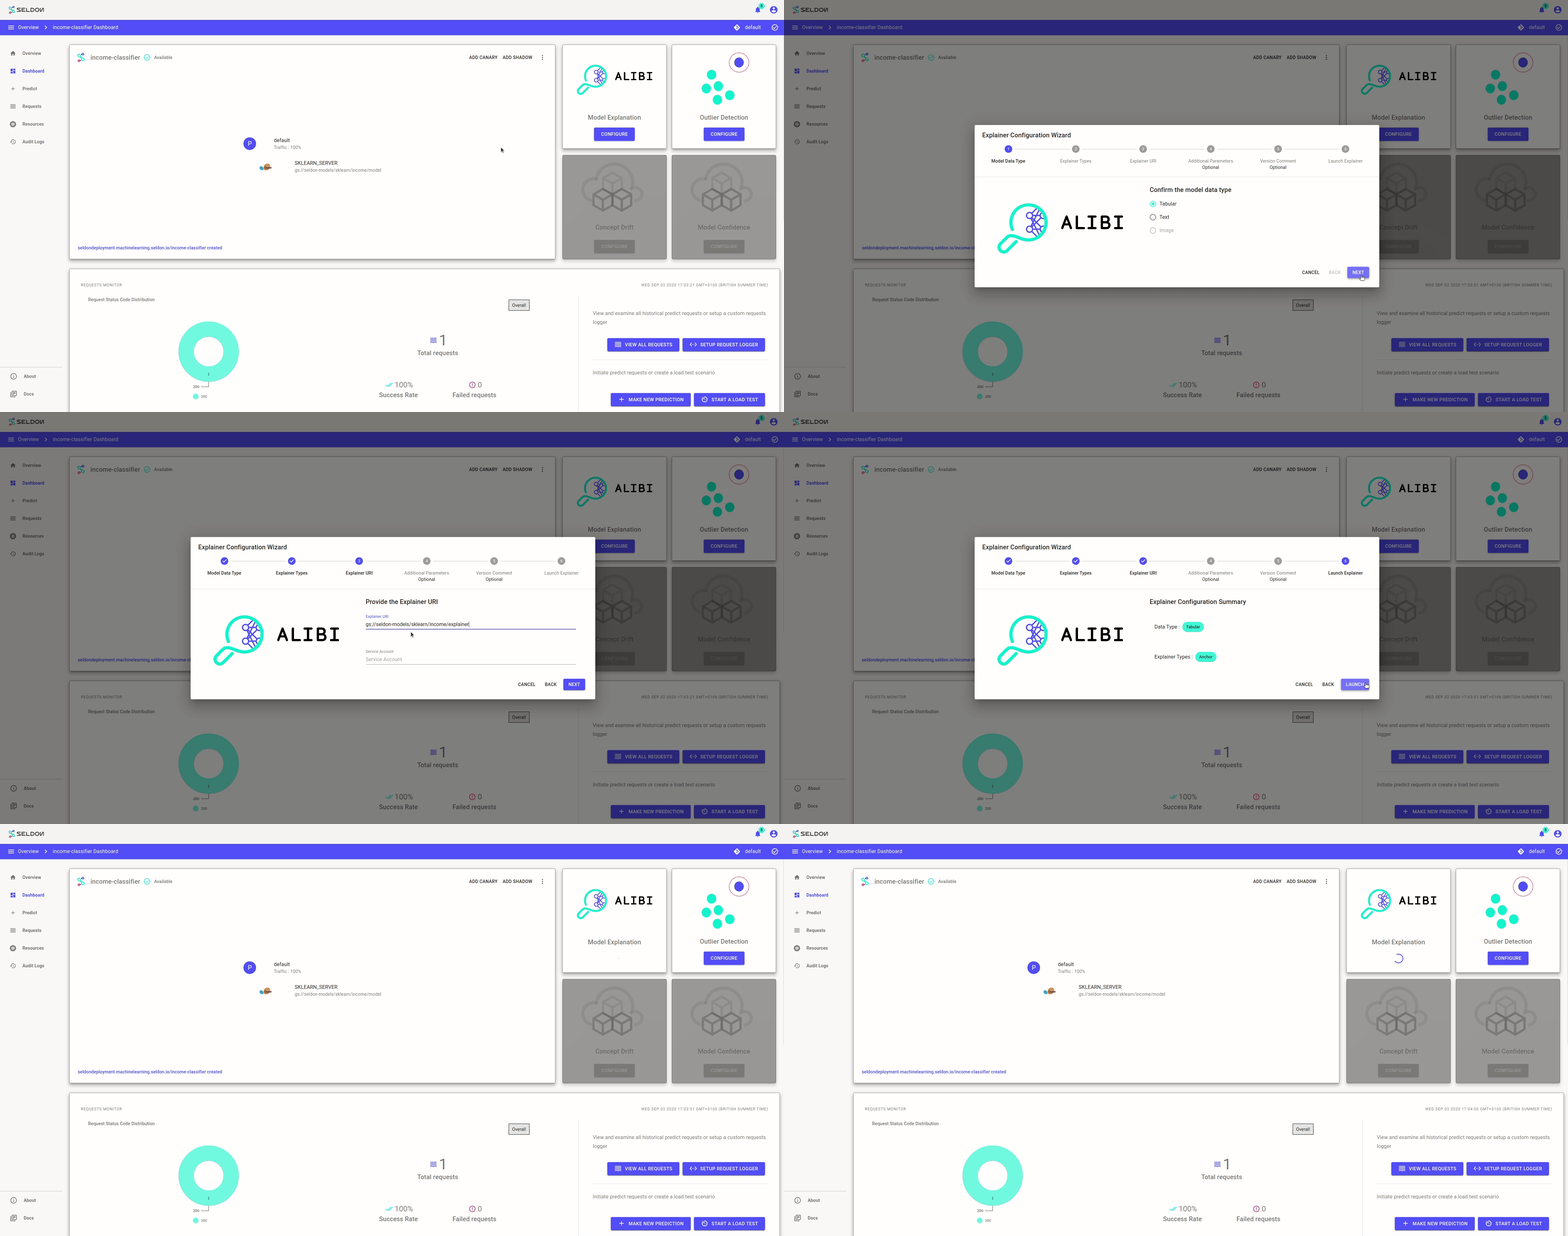
- Create an explainer for the model
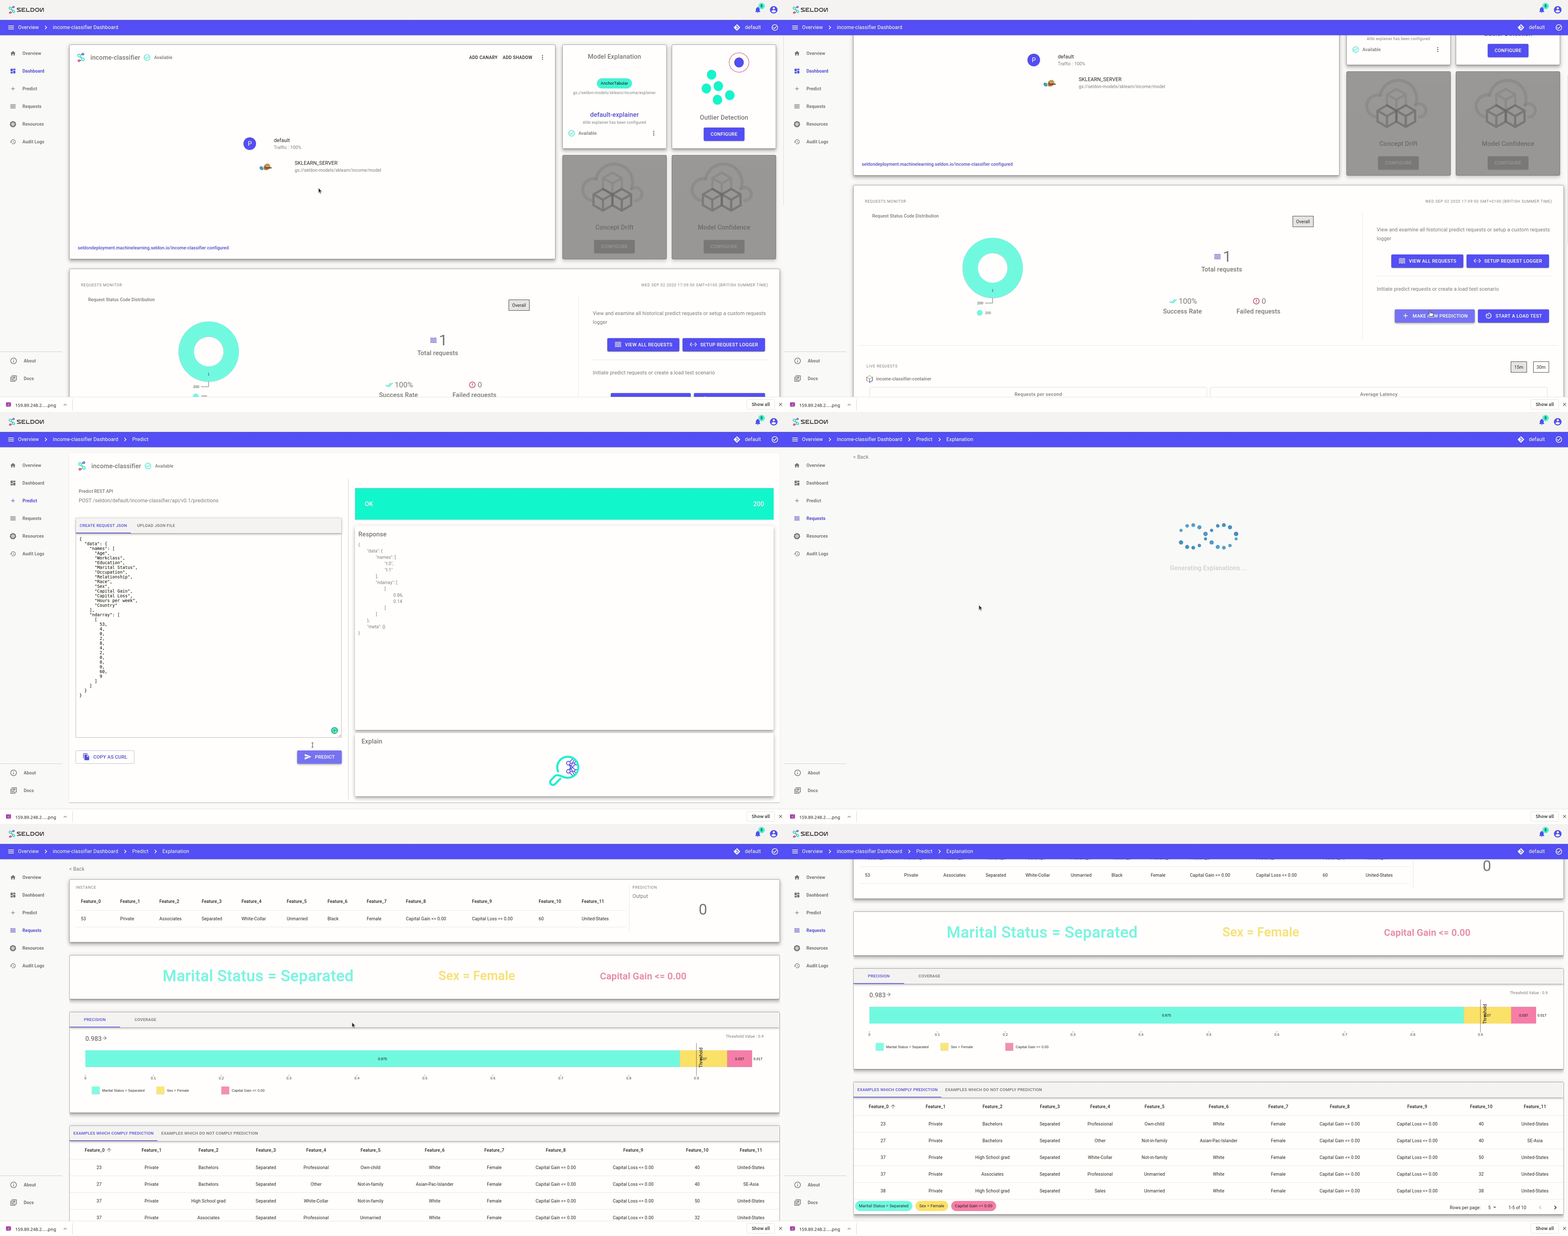
- Send the same request and then get an explanation for it
This model provides a model trained to predict high or low income based on demographic features from a 1996 US census.
Create Model
Use the model url:
gs://seldon-models/sklearn/income/model-0.23.2

Get Predictions
Run a single prediction using the JSON below.
{
  "data": {
    "names": [
      "Age",
      "Workclass",
      "Education",
      "Marital Status",
      "Occupation",
      "Relationship",
      "Race",
      "Sex",
      "Capital Gain",
      "Capital Loss",
      "Hours per week",
      "Country"
    ],
    "ndarray": [
      [
        53,
        4,
        0,
        2,
        8,
        4,
        2,
        0,
        0,
        0,
        60,
        9
      ]
    ]
  }
}
Add an Anchor Tabular Explainer
Create an model explainer using the URL below for the saved explainer.
gs://seldon-models/sklearn/income/explainer-py36-0.5.2

Get Explanation for one Request
Resend a single request and then explain it using the JSON below:
{
  "data": {
    "names": [
      "Age",
      "Workclass",
      "Education",
      "Marital Status",
      "Occupation",
      "Relationship",
      "Race",
      "Sex",
      "Capital Gain",
      "Capital Loss",
      "Hours per week",
      "Country"
    ],
    "ndarray": [
      [
        53,
        4,
        0,
        2,
        8,
        4,
        2,
        0,
        0,
        0,
        60,
        9
      ]
    ]
  }
}
Last modified November 4, 2020: Adding demo for monitoring accuracy metrics (ee9f228)