We use analytics and cookies to understand site traffic. Information about your use of our site is shared with Google for that purpose.You can read our privacy policies and terms of use etc by clicking here.
Usage Monitoring
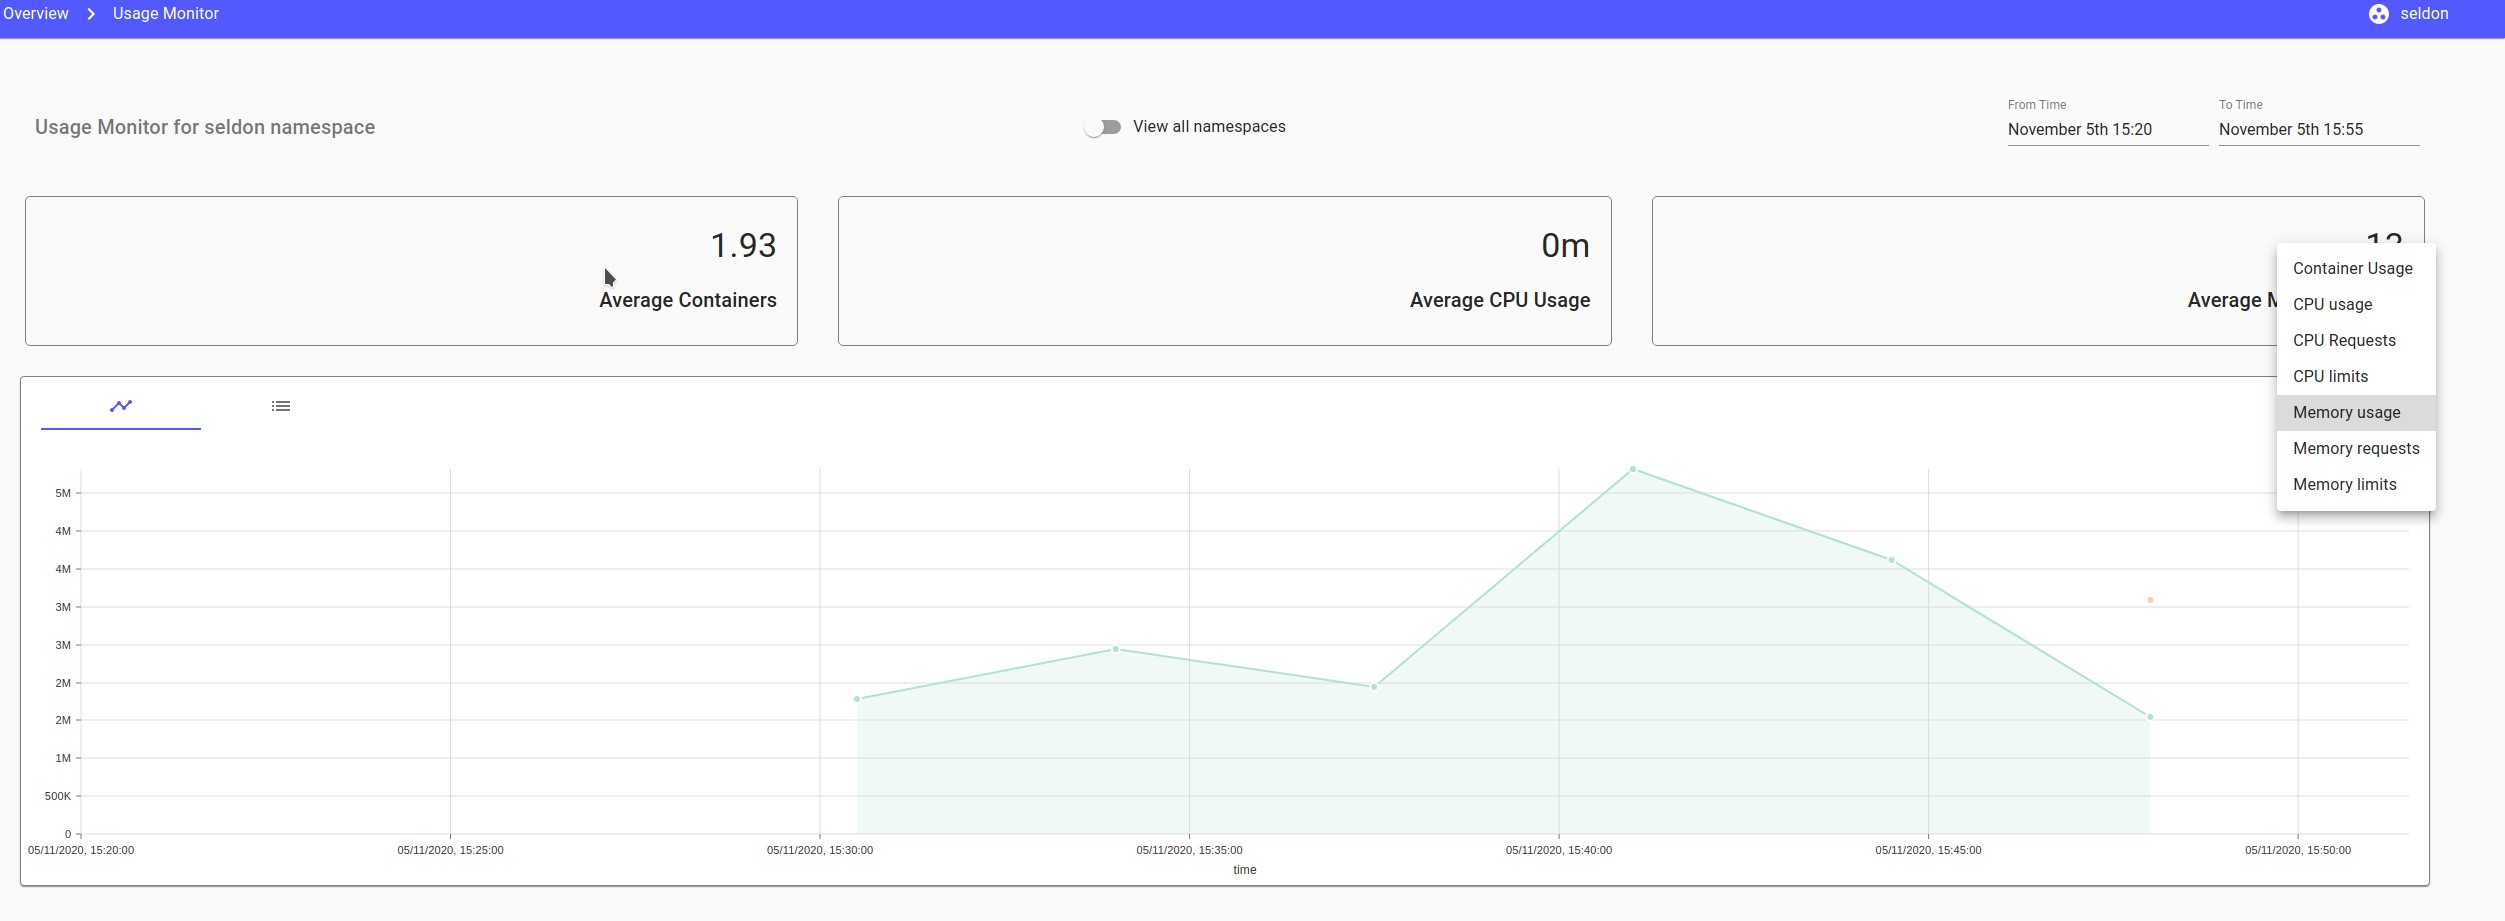
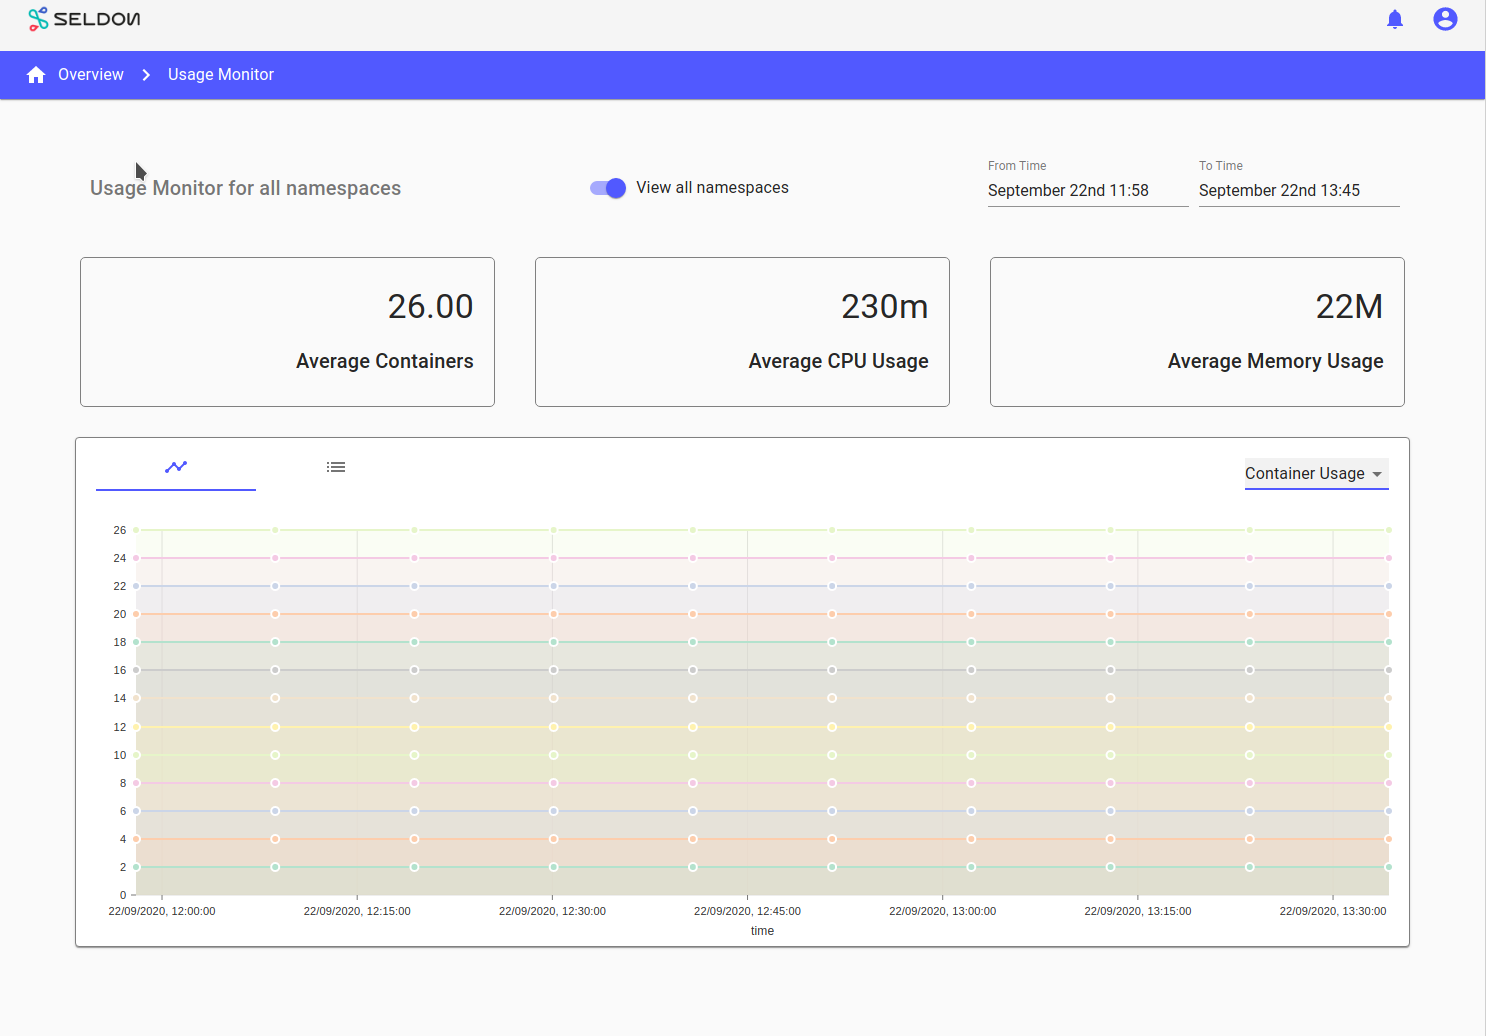
Summary metrics are available showing usage over time. These can be accessed from ‘Usage’ on the top-right menu.
These metrics differ from those shown for individual models on their pages. The summary metrics show multiple models for a namespace or cluster.
By default if the cluster-level is chosen then all models are counted for all namespaces. If you wish to restrict to namespaces visible to the user, set the FILTER_USAGE_MON_NAMESPACES environment variable to true.
Resources are shown broken down by model. The type of resource of interest can be chosen. The containers resource is shown with a comparison against what your license allows for.

Models are stacked on top of each other in the breakdown when there are multiple
